Bar Chart
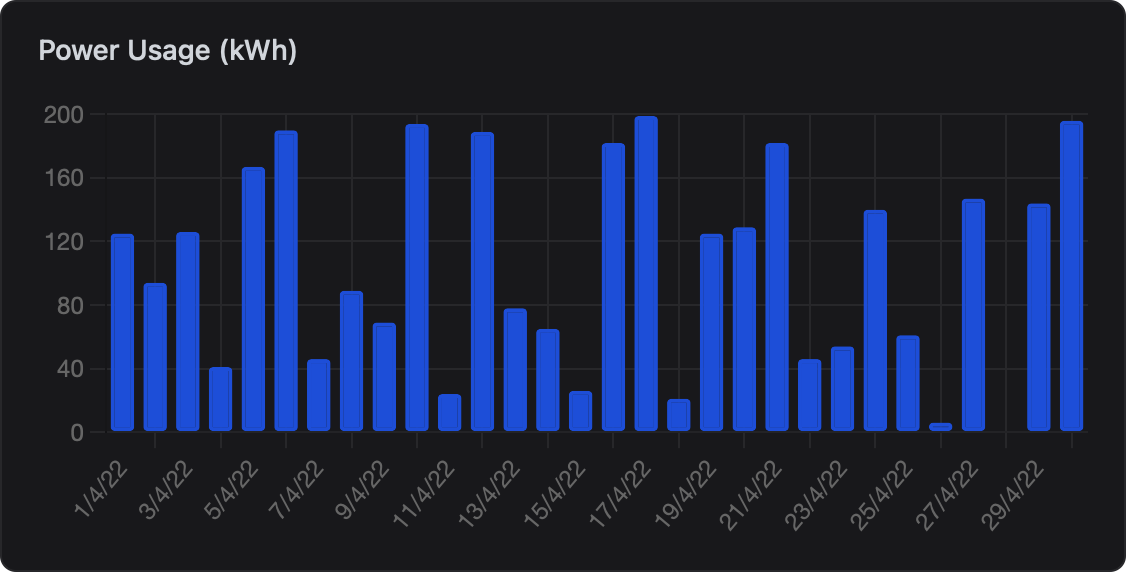
Bar charts are perfect for comparing quantities across categories. In ESP-DASH v5, the dash::BarChart<X, Y> class allows you to create bar charts with flexible data types for both axes.
Initializer
To create a bar chart, instantiate dash::BarChart<X, Y> with your dashboard instance and a descriptive title. The template parameters X and Y define the types for the X and Y axes, respectively. Choose types that match your data:
Example 1: String labels (days), integer values
// X-axis: days of the week (labels), Y-axis: sales (int)
dash::BarChart<const char*, int> bar(dashboard, "Sales by Day");
Example 2: Integer X, float Y
// X-axis: time (seconds), Y-axis: production (float)
dash::BarChart<int, float> bar2(dashboard, "Production");
Example 3: Float X and Y
// X-axis: float (e.g., time), Y-axis: float (e.g., value)
dash::BarChart<float, float> bar3(dashboard, "Value");
Just make sure the arrays you pass to setX and setY match the types you specify in the template.
Callback
Bar charts are for data visualization and do not require a callback for user interaction.
Methods
setX(X arr_x[], size_t x_size)
Sets the values for the X-axis. The type of arr_x must match the template type you chose for X.
// If X is const char* (labels):
bar.setX(XAxis, 5); // XAxis is const char*[]

// If X is int:
bar2.setX(timeArray, 10); // timeArray is int[]- Signature:
void setX(X arr_x[], size_t x_size) - Parameters:
X arr_x[]— Array of X-axis values.size_t x_size— Number of elements in the array.
- Returns:
void
setY(Y arr_y[], size_t y_size)
Sets the values for the Y-axis. The type of arr_y must match the template type you chose for Y.
// If Y is int:
bar.setY(YAxis, 5); // YAxis is int[]

// If Y is float:
bar2.setY(prodArray, 10); // prodArray is float[]- Signature:
void setY(Y arr_y[], size_t y_size) - Parameters:
Y arr_y[]— Array of Y-axis values.size_t y_size— Number of elements in the array.
- Returns:
void
x()
Returns a pointer to the current X-axis data array. The return type matches your template type for X.
// If X is const char*:
const char** labels = bar.x();

// If X is int:
int* times = bar2.x();- Signature:
X* x() - Parameters: None
- Returns:
X*— Pointer to the current X-axis data array.
y()
Returns a pointer to the current Y-axis data array. The return type matches your template type for Y.
// If Y is int:
int* values = bar.y();

// If Y is float:
float* prods = bar2.y();- Signature:
Y* y() - Parameters: None
- Returns:
Y*— Pointer to the current Y-axis data array.
Reference
Below is a complete example showing how to initialize and update a bar chart. Comments explain each step for clarity.
// Create a bar chart for sales by day
// X-axis: days of the week (labels)
// Y-axis: sales values

dash::BarChart<const char*, int> bar(dashboard, "Sales by Day");

// Data arrays must be global so the chart can access them at any time
const char* XAxis[] = {"Mon", "Tue", "Wed", "Thu", "Fri"};
int YAxis[] = {10, 20, 15, 30, 25};

void setup() {
  // Set X and Y axis data for the chart
  bar.setX(XAxis, 5);
  bar.setY(YAxis, 5);
}

// Later in your code, you can update YAxis[] values directly to update the chart in real time