Line Chart
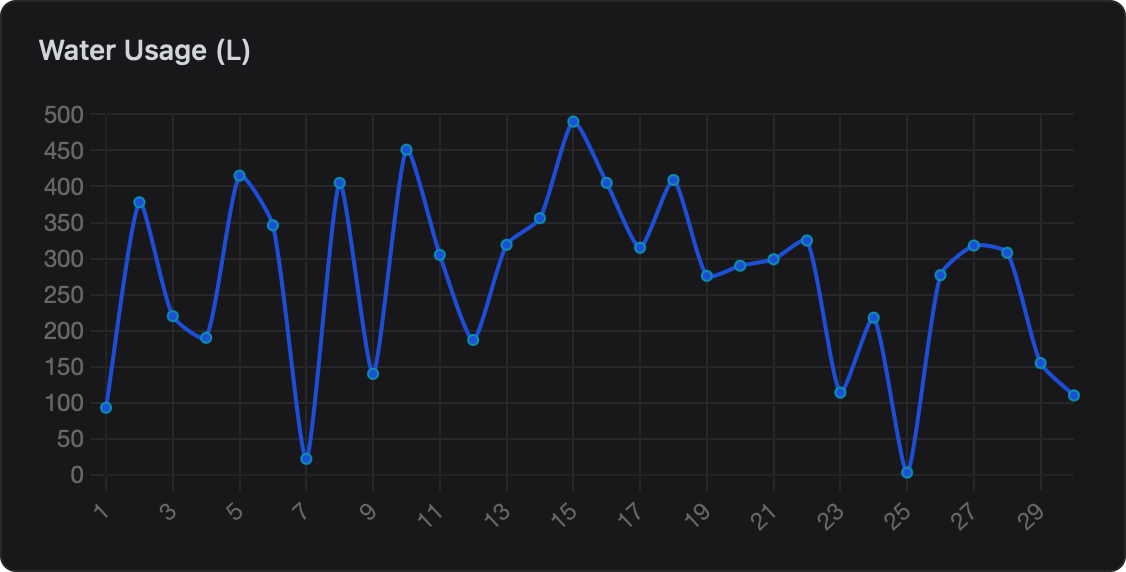
Line charts are ideal for visualizing trends and changes in data over time or ordered categories. In ESP-DASH v5, the dash::LineChart<X, Y> class provides a flexible, type-safe way to create and update line charts with a variety of data types.
Initializer
To create a line chart, instantiate dash::LineChart<X, Y> with your dashboard instance and a descriptive title. The template parameters X and Y define the types for the X and Y axes, respectively. Choose types that match your data:
Example 1: String labels (days), integer values
// X-axis: days of the week (labels), Y-axis: water usage (int)
dash::LineChart<const char*, int> line(dashboard, "Water Usage (L)");
Example 2: Integer X, float Y
// X-axis: time (seconds), Y-axis: temperature (float)
dash::LineChart<int, float> line2(dashboard, "Temperature");
Example 3: Float X and Y
// X-axis: float (e.g., time), Y-axis: float (e.g., voltage)
dash::LineChart<float, float> line3(dashboard, "Voltage");
Just make sure the arrays you pass to setX and setY match the types you specify in the template.
Callback
Line charts are for data visualization and do not require a callback for user interaction.
Methods
setX(X arr_x[], size_t x_size)
Sets the values for the X-axis. The type of arr_x must match the template type you chose for X when creating the chart. For example, if you used const char* for X, pass an array of strings; if you used int, pass an array of integers.
// If X is const char* (labels):
line.setX(XAxis, 7); // XAxis is const char*[]

// If X is int:
line2.setX(timeArray, 10); // timeArray is int[]- Signature:
void setX(X arr_x[], size_t x_size) - Parameters:
X arr_x[]— Array of X-axis values.size_t x_size— Number of elements in the array.
- Returns:
void
setY(Y arr_y[], size_t y_size)
Sets the values for the Y-axis. The type of arr_y must match the template type you chose for Y. For example, if you used int for Y, pass an array of integers; if you used float, pass an array of floats.
// If Y is int:
line.setY(YAxis, 7); // YAxis is int[]

// If Y is float:
line2.setY(tempArray, 10); // tempArray is float[]- Signature:
void setY(Y arr_y[], size_t y_size) - Parameters:
Y arr_y[]— Array of Y-axis values.size_t y_size— Number of elements in the array.
- Returns:
void
x()
Returns a pointer to the current X-axis data array. The return type matches your template type for X.
// If X is const char*:
const char** labels = line.x();

// If X is int:
int* times = line2.x();- Signature:
X* x() - Parameters: None
- Returns:
X*— Pointer to the current X-axis data array.
y()
Returns a pointer to the current Y-axis data array. The return type matches your template type for Y.
// If Y is int:
int* values = line.y();

// If Y is float:
float* temps = line2.y();- Signature:
Y* y() - Parameters: None
- Returns:
Y*— Pointer to the current Y-axis data array.
Reference
Below is a complete example showing how to initialize and update a line chart in a real project. This demonstrates global data arrays, initialization, setup, updating values, and sending updates to the dashboard.
#include <ESPDashPro.h>

ESPDash dashboard;
dash::LineChart<const char*, int> line(dashboard, "Water Usage (L)");

// Global data arrays for chart
const char* XAxis[] = {"Sun", "Mon", "Tue", "Wed", "Thu", "Fri", "Sat"};
int YAxis[] = {0, 0, 0, 0, 0, 0, 0};

void setup() {
  // ...dashboard/network setup...
  // Set X and Y axis data for the chart
  line.setX(XAxis, 7);
  line.setY(YAxis, 7);
}

void loop() {
  // Example: update YAxis values in real time
  static unsigned long lastUpdate = 0;
  if (millis() - lastUpdate > 5000) { // Every 5 seconds
    lastUpdate = millis();
    // Simulate new data (e.g., random water usage)
    for (int i = 0; i < 7; i++) {
      YAxis[i] = random(0, 100);
    }
    // No need to call setY again; just update the array and send updates
    dashboard.sendUpdates();
  }
}